
The missing building block in cookstove dMRV: systems that talk to each other
Walk into almost any cookstove project today and ask to see the "digital MRV." You'll be shown sensors. Stove Use Monitors strapped to a sample of stoves, beaming temperature traces back to a dashboard, proving the stoves are actually being used. It looks like the future. And it is a real improvement on the old way, where a field team turned up every few months with a clipboard and a sample survey.
But look more closely and you'll notice the digital part stops at monitoring. The reporting and the verification — the R and the V in MRV — are still being done by hand. Someone exports the sensor data into a spreadsheet. Someone else exports the survey data into a different spreadsheet. Then a person sits down and tries to make the two agree before anything goes to a standard body. That's not digital MRV. That's digital monitoring bolted onto a manual back office.
This gap isn't a detail. It's the building block that's missing from the whole stack, and it's worth being honest about why.

How we got two systems that don't talk
Traditional cookstove MRV was built on surveys. You sample a population of households, ask how many stoves are in use, how often, alongside what, and you extrapolate. The tooling for this matured years ago: KoboToolbox, SurveyCTO, ODK, and others let enumerators collect structured data on a phone and sync it back. The output, almost without exception, lands in Excel (and maybe Salesforce). That's where the usage rates, drop-off assumptions and adoption figures get worked out.
Sensors arrived later and from a completely different direction. They're hardware, and hardware comes with its own software. When you buy SUMs, you get the vendor's platform to go with them — that's where the temperature data is cleaned, where a "cooking event" is defined, and where usage is summarised. It's a good platform for what it does. But it was built to manage the vendor's devices, not to reconcile against your survey panel or to format an output a methodology will accept.
So you end up with two parallel worlds. Survey data in one set of tools feeding a spreadsheet. Sensor data in a vendor platform. Each is internally coherent. Neither was designed to meet the other. And the place they're supposed to meet — a single, reconciled dataset that the monitoring calculations actually run on — usually doesn't exist as a system. It exists as a person, a deadline, and a very large workbook.
"We do dMRV" usually means "we have sensors"
This is the part the market hasn't fully reckoned with. A lot of developers are deploying SUMs right now, and most of them will tell you they've moved to dMRV. What's actually happened is narrower: they've added sensors to satisfy an investor or a buyer who wanted harder evidence of usage. The sensor data sits there as raw proof. It hasn't been reconciled with the survey data, it hasn't been folded into the emission-reduction calculation, and it certainly isn't flowing into a standard body's system in any automated way.
There's nothing dishonest about this. Sensors are expensive and getting them into the field is hard enough on its own. But meeting an investor's expectations and meeting a standard body's requirements are two different bars. An investor wants reassurance that the stoves are used. A standard body wants one auditable dataset, produced by a defined process, that feeds the monitoring calculations and survives verification. Raw, unreconciled sensor traces clear the first bar and not the second.
Full dMRV is the second bar. It means survey and sensor data are brought together into a single reconciled dataset. That dataset feeds the monitoring calculations. And those calculations connect, where the infrastructure exists, into the standard body's own systems through their APIs — so that issuance isn't a manual re-keying exercise but a data flow. Digital from the field all the way to the registry. Monitoring, reporting and verification, not just monitoring.
Why almost nobody has built it
The reason this gap persists is mundane: building the connective tissue is genuinely hard and genuinely expensive. You need to ingest survey data from whichever tools your field teams use. You need to ingest sensor data from whichever vendor you bought from — and you may switch vendors, or run several. You need a way to match a sensor record to a household to a survey response, which is fiddly, because device IDs, household IDs and survey IDs were never designed to line up. You need the matched data to feed a calculation engine that follows a specific methodology. And you need that engine's output to be in a shape a standard body will accept.
ATEC has done this. Over roughly a decade they've built their own end-to-end data infrastructure, and it shows — they can stand behind their numbers in a way most developers can't. Credit where it's due. But the lesson isn't "every developer should go and build the same thing." The lesson is the opposite. If full dMRV requires every project developer to spend ten years and a fortune building bespoke data plumbing, then full dMRV will stay rare, and the integrity gains it promises will stay concentrated in the few organisations that could afford it. That's a bad outcome for a sector whose entire pitch rests on credibility.
The plumbing shouldn't be a competitive moat. It should be a commodity. Every cookstove developer needs roughly the same thing: get the survey data in, get the sensor data in, match them, reconcile them, calculate, and hand off to the registry. The specifics of a methodology change; the shape of the problem doesn't. That's exactly the kind of thing that should be solved once and made available to everyone, rather than rebuilt badly, in Excel, on every project.
The fix is interoperability, not more dashboards
It's tempting to think the answer is a better sensor platform or a slicker dashboard. It isn't. The missing piece is the layer underneath — the part that takes data from systems that were never meant to talk to each other and turns it into one dataset a methodology can run on and a registry can accept. Until that layer is normal infrastructure, "dMRV" will keep meaning "we put sensors on some stoves," and the reporting and verification will keep happening by hand, with all the cost, delay and error that implies.
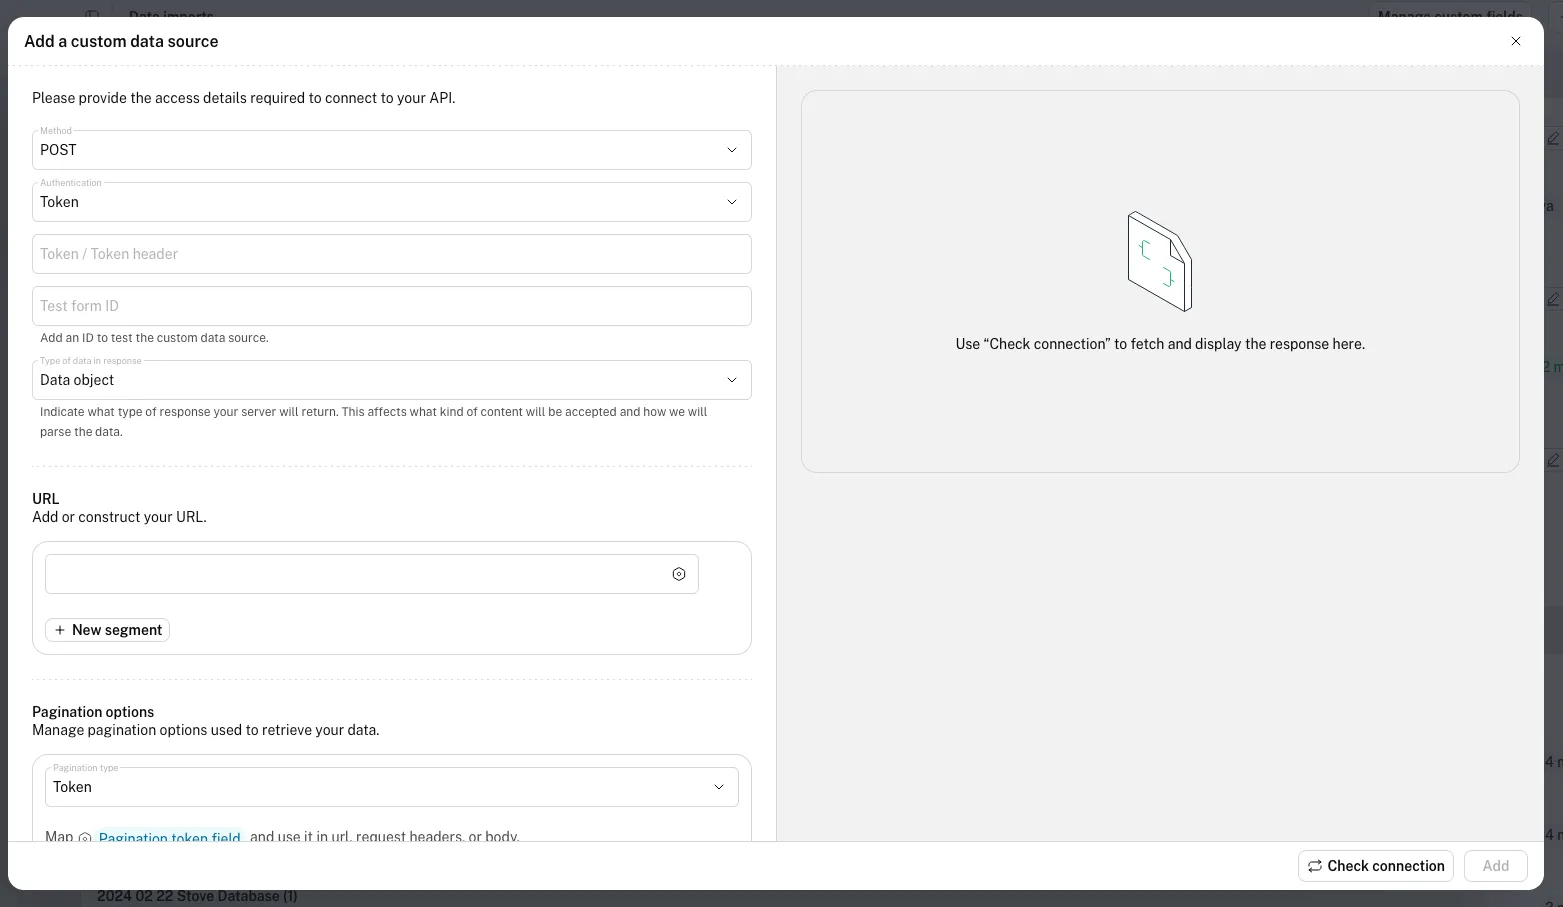
(CarbonHQ's custom data source feature)
This is the problem we built CarbonHQ's custom data source feature to solve. Survey data can be imported from the tools field teams already use. Sensor data can be ingested from custom data sources, whichever vendor it comes from. And a matching and linking function brings the two together into a single reconciled dataset — the building block that everything downstream depends on. The point isn't to add another silo. It's to close the gap between the ones that already exist, so that developers can do full dMRV without first having to become a data infrastructure company.
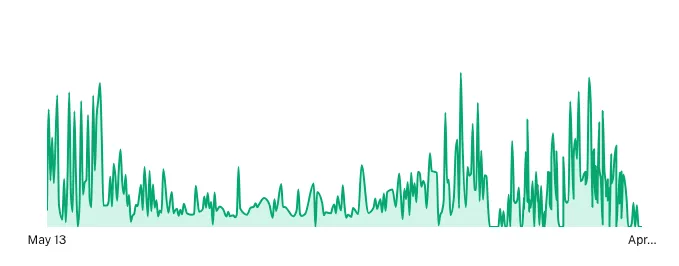
(Sample sensor data displayed on CarbonHQ)
This isn't theoretical. We're already running it with 180.Works, PowerUP and Carbon 4 Safe Water, with Spouts coming on soon — real projects bringing survey and sensor data together into one reconciled dataset rather than wrestling two systems by hand.
The sensors were the easy part. Getting the data to agree is where dMRV actually begins.
If this is a problem you're living with, I'd like to hear about it. Email me at [email protected].